
The weekly client update usually starts with copying tasks into a spreadsheet and ends with a PDF nobody enjoyed making. In Taskift the report comes straight from the board, and it reads like a note from you, not a data dump.
1. What your client gets
One page with your workspace name on top and the project laid out in the order a client cares about:
- A note from you on the cover, signed with your name. Leave it blank and Taskift writes the summary from the numbers: how much got finished, which milestone is done, and what needs a decision from the client.
- Progress at a glance: percent complete, tasks done, on-time rate, turnaround and billable hours.
- Delivered this period: every finished task and the day it was done.
- Progress over time and milestones, with any milestone at risk flagged.
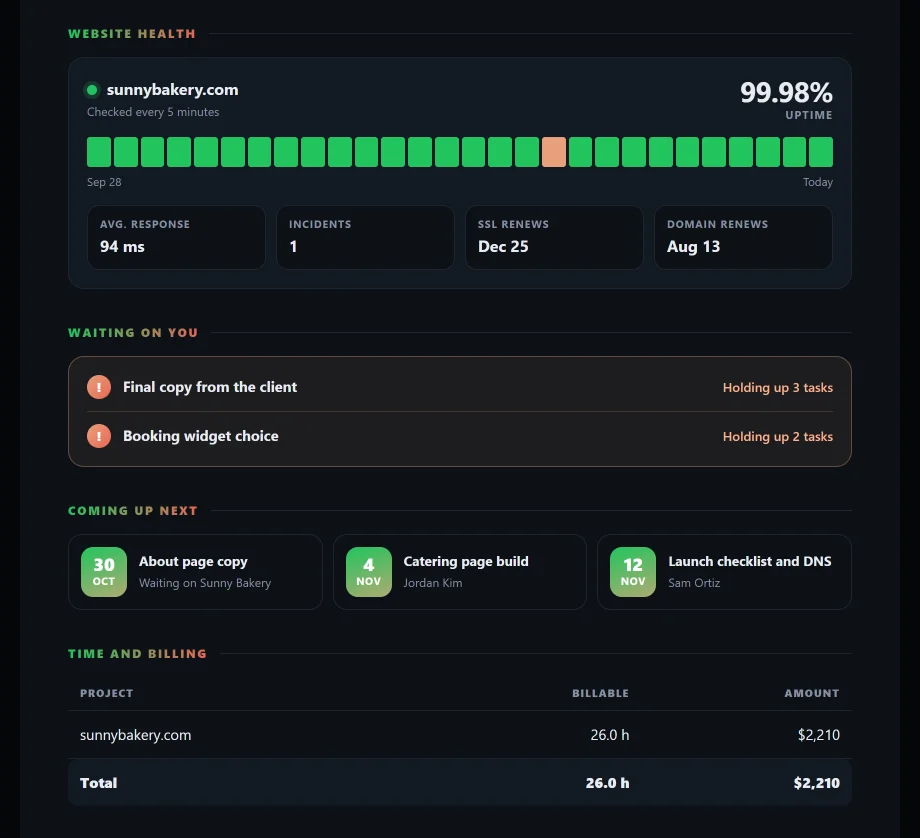
- Website health for projects with Site Health turned on: uptime for each day, average response time, incidents, and when the SSL certificate and the domain renew.
- Waiting on you: tasks that are holding up other work, and how many tasks each one blocks.
- Coming up next: what's due in the next three weeks and who has it.
- Time and billing: billable hours and what they come to at the project's rate.
- Next check-in at the bottom, so the client knows when they'll hear from you.
The report follows the reader's device, light or dark, with a switch at the top. It reads well on a phone, and when it's printed or saved as a PDF it always comes out light.
2. Make one in under a minute
- Open Reports, filter to the client's project and pick the period, like Last Month.
- Click Export, then Client report (PDF).
- Type a short note, check the signature and set the next check-in date. All three are optional. Taskift remembers them for that project on your computer, so next month you edit last month's note instead of starting from scratch.
- Click Open report. It opens in a new tab with the print window ready: choose Save as PDF and attach it to your email.
3. The numbers behind it
The client report is built from the same Reports view your team uses. Six tiles give the short version: total tasks, completed, completion rate, lead time, cycle time and overdue. Charts show burndown and burnup, where tasks pile up by status, workload by person, milestone progress and the tasks blocking others. CSV data under Export gives you every number for your own records.
Every task has a timer. Set an hourly rate on the project's Client tab and the billable hours turn into an amount on the report, ready as invoice backup.